Tools for Creating Charts and Diagrams
Free Software
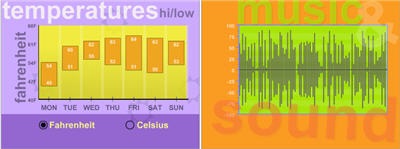
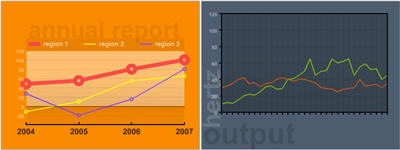
XML/SWF Charts is a simple, yet powerful tool to create attractive web charts and graphs from dynamic XML data. Create an XML source to describe a chart, then pass it to this tool’s flash file to generate the chart. The XML source can be prepared manually, or generated dynamically using any scripting language (PHP, ASP, CFML, Perl, etc.) XML/SWF Charts makes the best of both the XML and SWF worlds. XML provides flexible data generation, and Flash provides the best graphic quality.
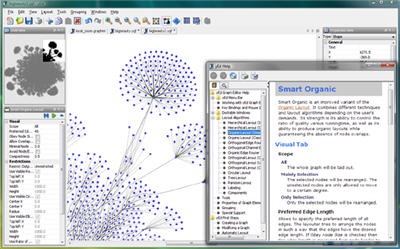
yEd is a very powerful graph editor that is written entirely in the Java programming language. It can be used to quickly and effectively generate drawings and to apply automatic layouts to a range of different diagrams and networks. yEd can be used to automatically lay out complex graph structures. Several highly sophisticated layout algorithms have been implemented and shipped with yEd. They can be used either to automatically arrange the items or to support the user when undertaking a manual layout.
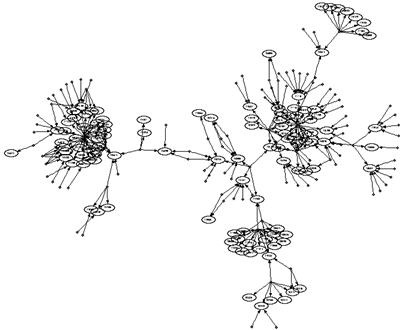
Graphviz is a way of representing structural information as diagrams of abstract graphs and networks. Automatic graph drawing has many important applications in software engineering, database and web design, networking, and in visual interfaces for many other domains. The Graphviz layout programs take descriptions of graphs in a simple text language, and make diagrams in several useful formats such as images and SVG for web pages, Postscript for inclusion in PDF or other documents; or display in an interactive graph browser. (Graphviz also supports GXL, an XML dialect.) Graphviz has many useful features for concrete diagrams, such as options for colors, fonts, tabular node layouts, line styles, hyperlinks, and custom shapes.
Kivio is an easy to use diagramming and flowcharting application with tight integration to the other KOffice applications. It enables you to create network diagrams, organization charts, flowcharts and more. Its features are: scriptable stencils using Python, support for Dia stencils, plugin framework for adding more functionality.
Unified Modeling Language (UML) is a general-purpose modeling language that includes a graphical notation used to create an abstract model of a system, referred to as a UML model. UML is not restricted to modeling software. UML is also used for business process modeling, systems engineering modeling, and representing organizational structures. The Systems Modeling Language (SysML) is a Domain-Specific Modeling language for systems engineering that is defined as a UML 2.0 profile. UML models may be automatically transformed to other representations (e.g. Java) by means of QVT-like transformation languages, supported by the OMG.
DIA is a gtk+ based diagram creation program released under the GPL license. It is inspired by the commercial Windows program ‘Visio’, though more geared towards informal diagrams for casual use. It can be used to draw many different kinds of diagrams. It currently has special objects to help draw entity relationship diagrams, UML diagrams, flowcharts, network diagrams, and many other diagrams. It is also possible to add support for new shapes by writing simple XML files, using a subset of SVG to draw the shape. It can load and save diagrams to a custom XML format (gzipped by default, to save space), can export diagrams to a number of formats, including EPS, SVG, XFIG, WMF and PNG, and can print diagrams (including ones that span multiple pages).
JFreeChart is a free 100% Java chart library that makes it easy for developers to display professional quality charts in their applications. JFreeChart’s extensive feature set includes: a consistent and well-documented API, supporting a wide range of chart types; a flexible design that is easy to extend, and targets both server-side and client-side applications; support for many output types, including Swing components, image files (including PNG and JPEG), and vector graphics file formats (including PDF, EPS and SVG).
JpGraph is a Object-Oriented Graph creating library for PHP >= 4.3.1 The library is completely written in PHP and ready to be used in any PHP scripts (both CGI/APXS/CLI versions of PHP are supported). The library can be used to create numerous types of graphs either on-line or written to a file. JpGraph makes it easy to draw both “quick and dirty” graphs with a minimum of code as well as complex graphs which requires a very fine grained control. The library assigns context sensitive default values for most of the parameters which minimizes the learning curve.
Free Online Tools
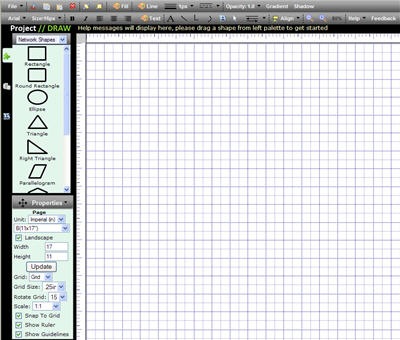
Autodesk Labs Project Draw (former Cumulate Draw) is a new feature-rich web-based vector drawing application built by the Labs team. Use it to create simple floor plans, electronic-circuit diagrams, network diagrams, user interface mock-ups, and more. Save your work in a variety of formats on our server or yours. No plug-ins or downloads required – if you have a JavaScript-enabled Internet Explorer or Firefox browser, you’re good to go. Features include: predefined shapes – drag and drop our vector shapes to create custom diagrams. You can save your diagram in editable formats, export your diagrams in a variety of formats, including PDF, JPG, PNG, and SVG. It is cross-browser compatible – create a diagram in IE, open it in FireFox, or vice-versa.
Gliffy makes it simple to organize your thoughts and share them with family, colleagues, and organizations. When you take your ideas and organize them visually, it’s easier for you and others to really understand them. Plus, you can move things around on paper, test different options, and find the right solution.
MindMeister brings the concept of mind mapping to the web, using its facilities for real-time collaboration to allow truly global brainstorming sessions. Users can create, manage and share mind maps online and access them anytime, from anywhere. In brainstorming mode, fellow MindMeisters from around the world (or just in different rooms) can simultaneously work on the same mind map – and see each other’s changes as they happen. Using integrated Skype calls, they can throw around new ideas and put them down on “paper” at the same time.
Best4C (Best for chart) is a Web-based, online diagram tool that allows you to create, edit and share charts anytime, anywhere. It offers you a way to create and share charts online. No software installation. No downloads. Best4C provides an interactive drawing and diagramming solution within all popular Internet browsers (FireFox,IE,Opera,Safari).
DrawAnywhere is an online diagramming website, where you can draw, modify and share flowcharts and other diagrams, with the look & feel of a desktop application. It runs on any browser with Flash 9 installed. There is no need to download and install any custom software. It runs entirely on the web, and thus it is an always-on-access-anywhere solution. It meets all your diagramming needs without installing, maintaining and purchasing expensive software.
Best Commercial Products
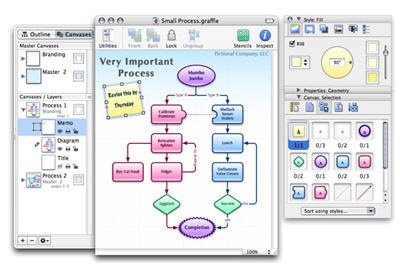
OmniGraffle is a powerful, yet easy to use diagramming and drawing tool. It can help you make amazing graphic documents quickly by keeping lines connected to shapes even when they’re moved, providing stencils full of common symbols for you to drag and drop, and magically organizing diagrams with just one click. Create flow charts, org charts, network diagrams, family trees, project processes, office layouts – or anything else that can be represented by symbols and lines. OmniGraffle 4 include a new dynamic outline view, diagram styles, a Bezier curve drawing tool, and greatly improved import and export options. OmniGraffle 4 Professional adds master canvases, notes, tables, document scale, improved Visio XML import and export, SVG export, and more. Price: Standard – $79.95, Professional – $149.95, upgrades start at $29.95.
Microsoft Visio is a business and technical diagramming program. Visualize, explore, and communicate complex information, systems, and processes. You can download free trial. Price starts at $259.95, upgrade from $129.95.
 Subscribe
November 22 at 5:44 am
Another Commercial Product: Rationale (www.austhink.com) is the leading tool for diagramming reasoning, debate and deliberation. It is broadly similar to mind-mapping, but is unique in providing support for the distinctive concepts and structures involved in argument structures. Use it to help make decisions, resolve disagreements, develop compelling cases, and generally to aid critical thinking.
November 22 at 11:42 am
Hey!
Thanks for a “terrifical” list!
I think yEd might be the answer to all of my nightmarish dreams…
November 22 at 8:46 pm
Nice collection, but you miss this online tool: Mind42
http://www.mind42.com/
November 22 at 9:06 pm
Those are some nice suggestions. yEd is a new one on me; I’ll have to check it out.
If I may offer a couple of suggestions, I spend a great deal of time plotting quantitative data, like the graphs from XML/SWF Charts. I’ve found the free R (http://www.r-project.org) and commercial SigmaPlot have both worked wonderfully. They excel at creating data plots that are clear, following the guidelines laid out by Edward Tufte and William Cleveland. R has quite a learning curve, while SigmaPlot is quite easy to use; both programs offer remarkable flexibility in graph creation and editing.
December 3 at 4:10 am
cool tips
December 18 at 6:02 am
Open Flash Charts should replace the first one (XML/SWF Charts)
http://teethgrinder.co.uk/open-flash-chart/
Best.
January 8 at 12:59 am
Before spending money on MindManager, you should check out FreeMind at http://freemind.sourceforge.net/ – neither are really diagramming tools, but FreeMind is a great java-based tool for mind-mapping; very handy.
February 3 at 5:03 am
The list is definitely great, but what about FlyCharts and Origramy? The first one (http://flycharts.net) is used for charts and diagrams making. The second one (http://origramy.com) creates flowcharts and flash graphs. I find them good enough
February 6 at 10:00 pm
Nice collection!
Also look at http://www.easydiagram.net It’s a responsive diagramming engine, it’s free, and an easy alternative to many diagram components. You will not need any plugin to run easydiagram.net. It uses AJAX and Javascript.
February 10 at 5:21 am
i want to put graph in gtk-window. then how can i put??
May 11 at 6:35 am
You might be interested in this Visio addin to layout diagrams with Graphviz:
http://www.calvert.ch/graphvizio/
Best regards,
Maurice Calvert
March 14 at 9:22 am
Nothing like order your custom chart… Try openflash or flashcharts.net
March 29 at 9:26 am
Nice round-up. My personal favourite is Actrix, a bit long in the tooth these days and a little short in its range of functions but very quick to get up and working.
September 10 at 7:11 am
Hi,
Can anyone please help me in suggesting a software which serves my need.
I am looking out for a standalone/embedded jar software which takes rule base xml as input and get me a graphical process flow diagram . I know its not a peice of cake to get easily so just want your suggestions mate. Any software available as such in market?
Thanks in advance.